AI Powered Trading Toolkit
AISTRYX goes beyond basic scanners by bringing structure and context together in a single, coherent view. Instead of looking at isolated indicators or single timeframes, the platform examines how price behaves across short, medium, and longer periods, helping you see how recent movement fits within the broader trend.
By combining immediate price action with higher level structure, AISTRYX helps explain not just what a stock is doing, but why it is behaving that way. This makes it easier to tell the difference between meaningful movement and short term noise, and to understand whether a move is supported by the wider market context or working against it.
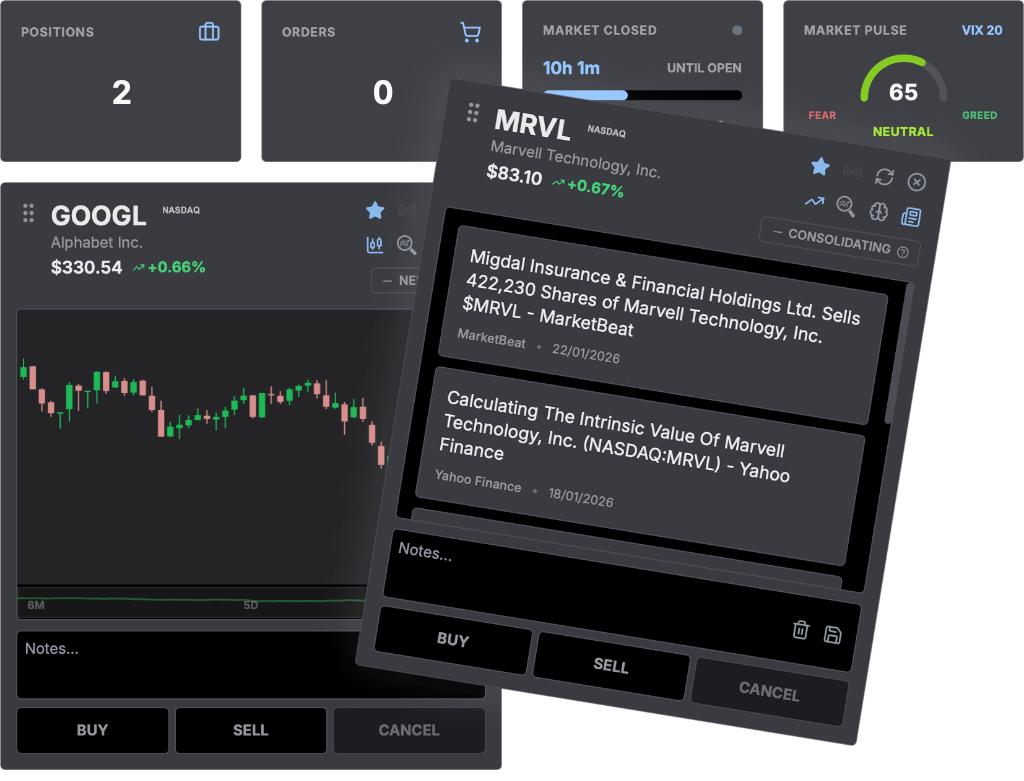
Stock Cards
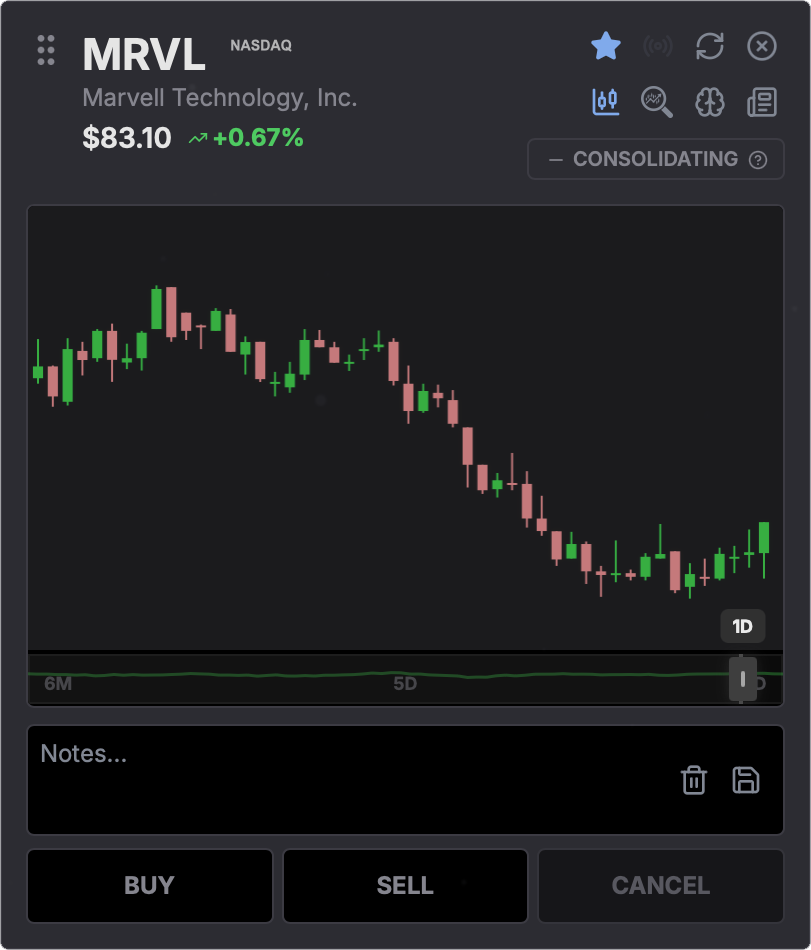
Chart View (Default)
A proprietary chart system coded from the ground up to display live OHLCV market data. Designed for clarity, it makes price behaviour easy to read so direction, momentum, and recent changes stand out without clutter.
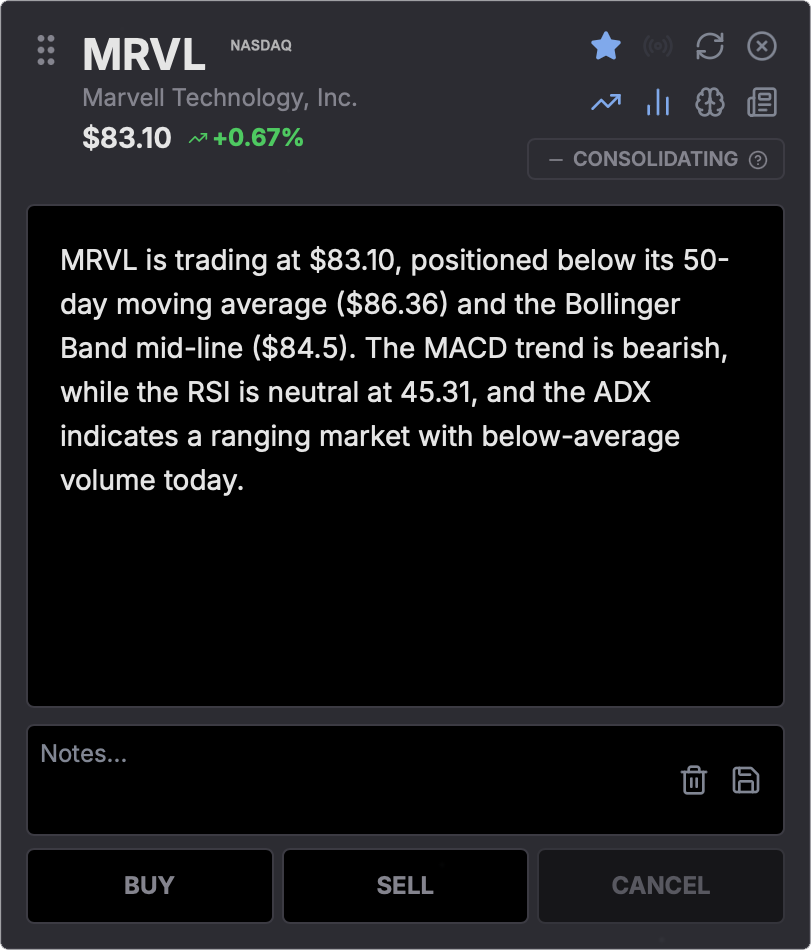
Analysis View
This gives you a clear, plain English read of what the stock is doing right now. It pulls together price, trend, momentum, and volume so you can quickly tell whether things are moving, drifting, or going nowhere.
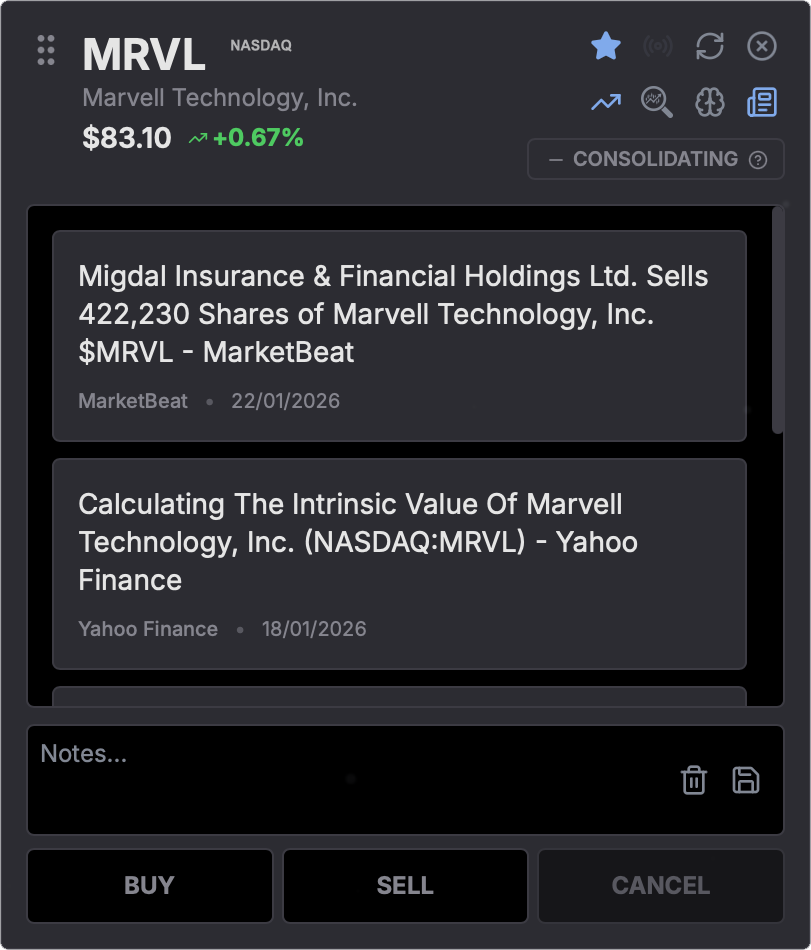
News View
This view pulls in the latest, most relevant news and commentary around the stock, presented as clean, readable cards. It gives you quick context on what's being said, what's changing, and what might be influencing price without sending you off to sort through headlines yourself.
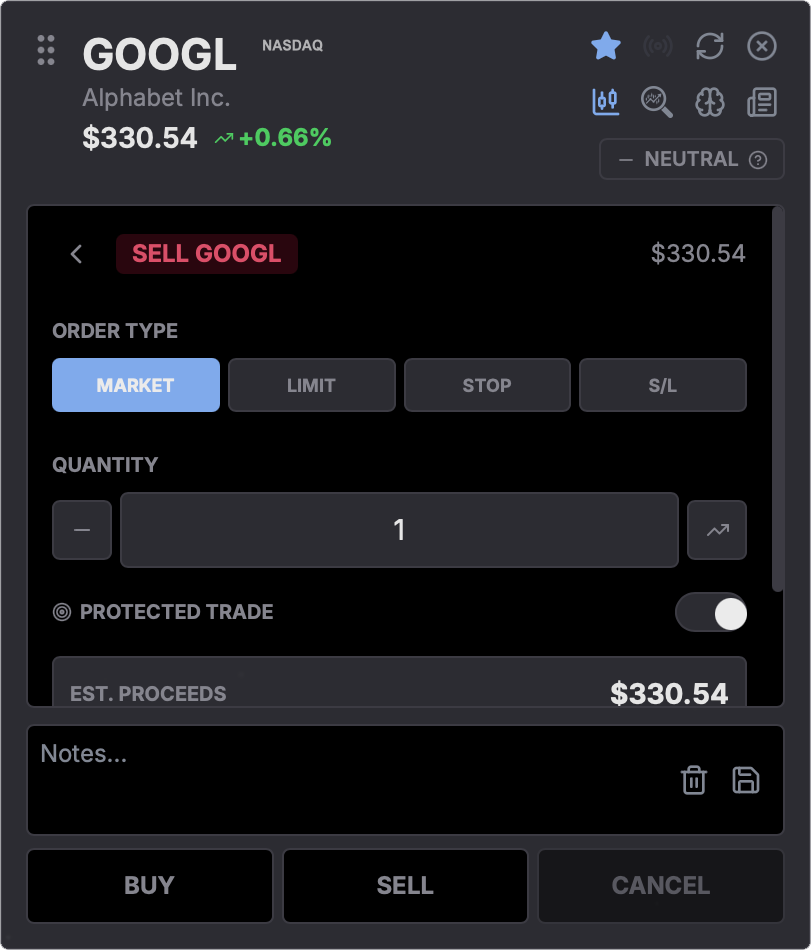
Execution View
This is where you actually make the trade. You pick how you want to buy or sell, set the amount, and add protection if you want, with the price and outcome shown clearly before you commit.
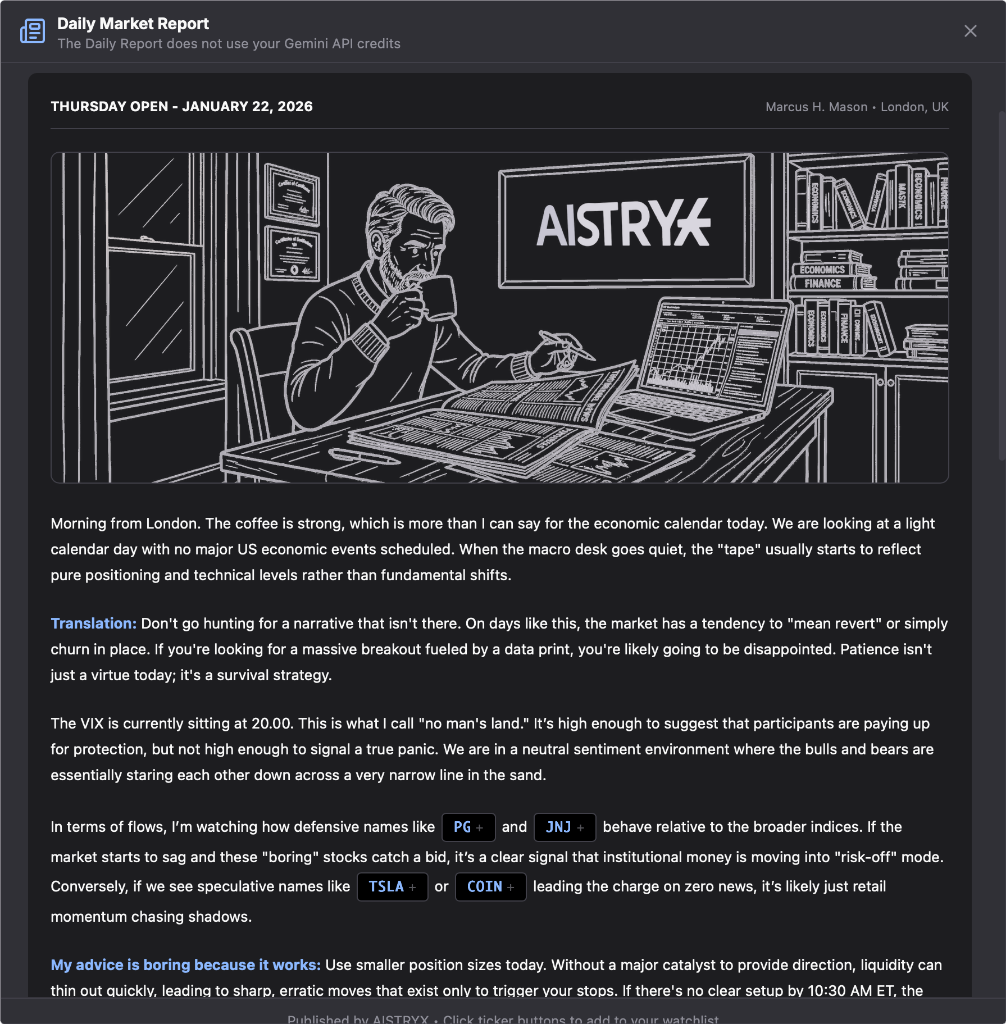
Daily Market Report
The daily report delivers a pre market summary of events that are already influencing price action. It combines overnight news, earnings outcomes, macro releases, and policy updates with live market indicators such as index futures, bond yields, and currency movement.
Stocks are highlighted where news and price behaviour are aligned, making it easier to identify names that may remain active or volatile during the session. The report is designed to replace hours of manual scanning with a single, structured briefing.
Stock Scanner
Scan the stocks you care about and see the important information pulled together in one place. Each stock is shown as a clear, focused card that helps you understand the setup before making a decision.
Price and Momentum
RSI, MACD, and short term movement to show pressure and pace.
Trend Context
Moving averages and ADX to indicate whether price is trending or ranging.
Volatility
Bollinger Bands and range behaviour to highlight compression, expansion, and key levels.
Volume and Participation
VWAP and volume ratios to show conviction behind price moves.
Positioning Context
Short interest and institutional exposure for broader positioning insight.
Options Activity
Put call ratios and implied volatility to reflect market expectations.