Cada función, diseñada para inversores
AISTRYX goes beyond basic scanners by bringing structure and context together in a single, coherent view. Instead of looking at isolated indicators or single timeframes, the platform examines how price behaves across short, medium, and longer periods, helping you see how recent movement fits within the broader trend.
By combining immediate price action with higher level structure, AISTRYX helps explain not just what a stock is doing, but why it is behaving that way. This makes it easier to tell the difference between meaningful movement and short term noise, and to understand whether a move is supported by the wider market context or working against it.
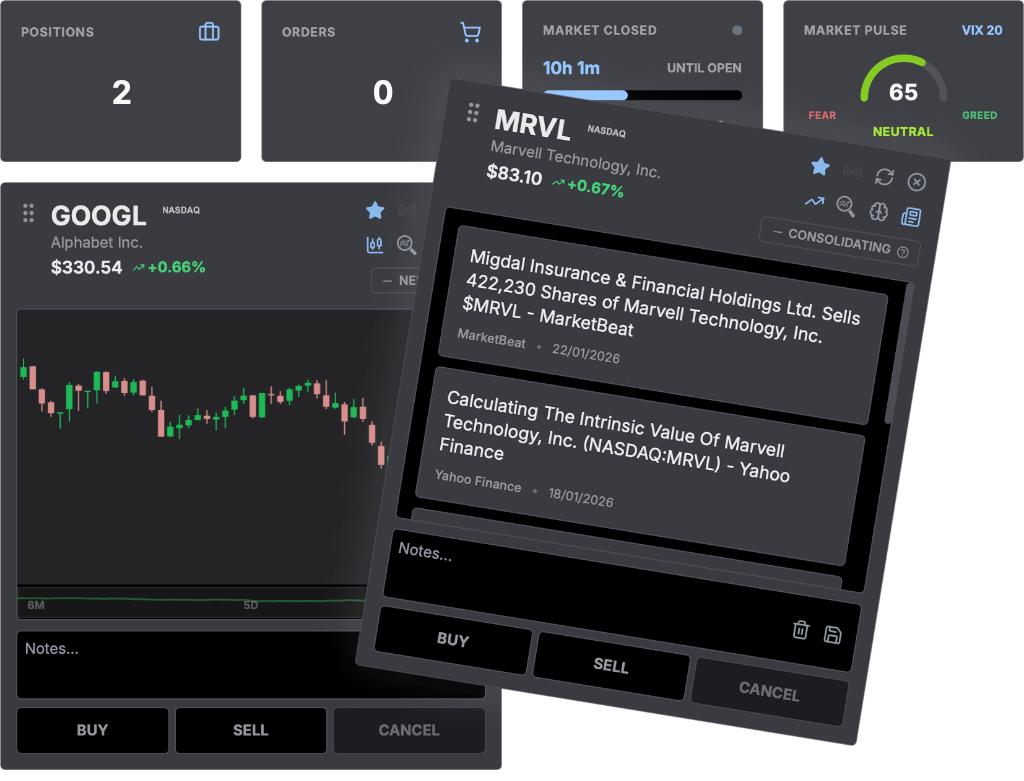
Stock Cards
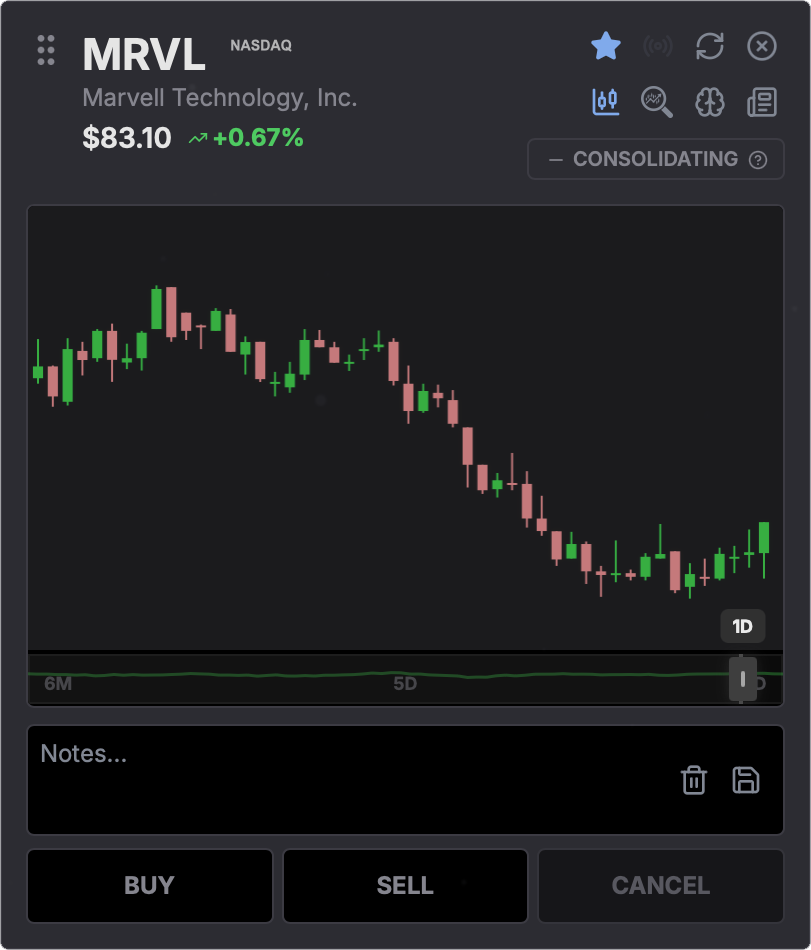
FeaturesPage.toolkit.chartView.title
FeaturesPage.toolkit.chartView.description
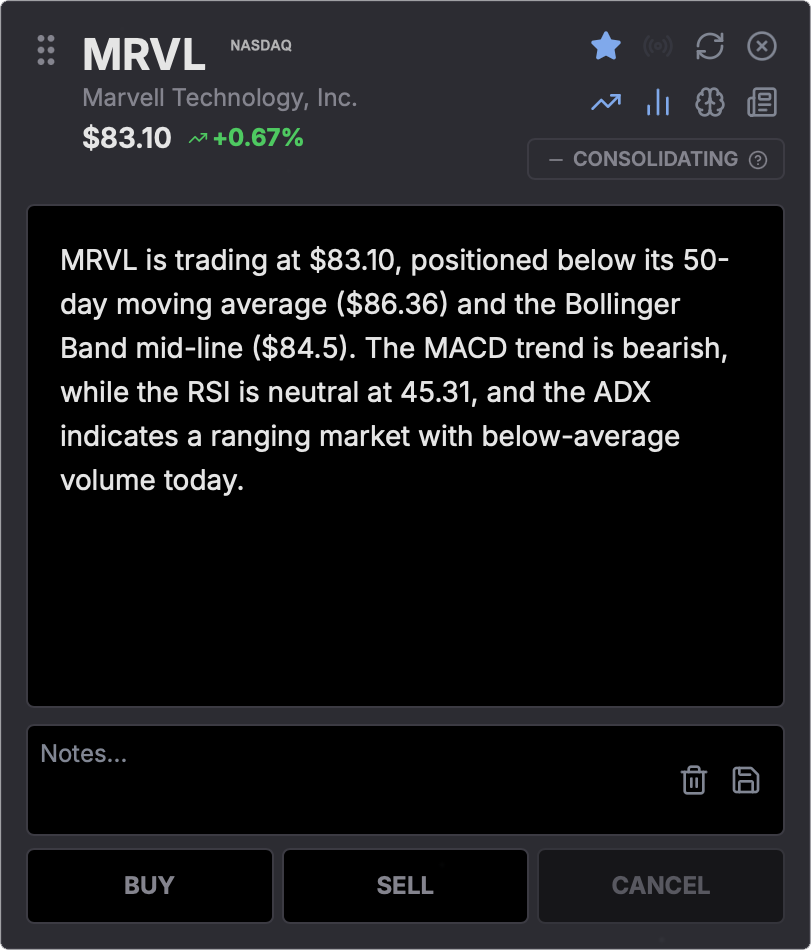
FeaturesPage.toolkit.analysisView.title
FeaturesPage.toolkit.analysisView.description
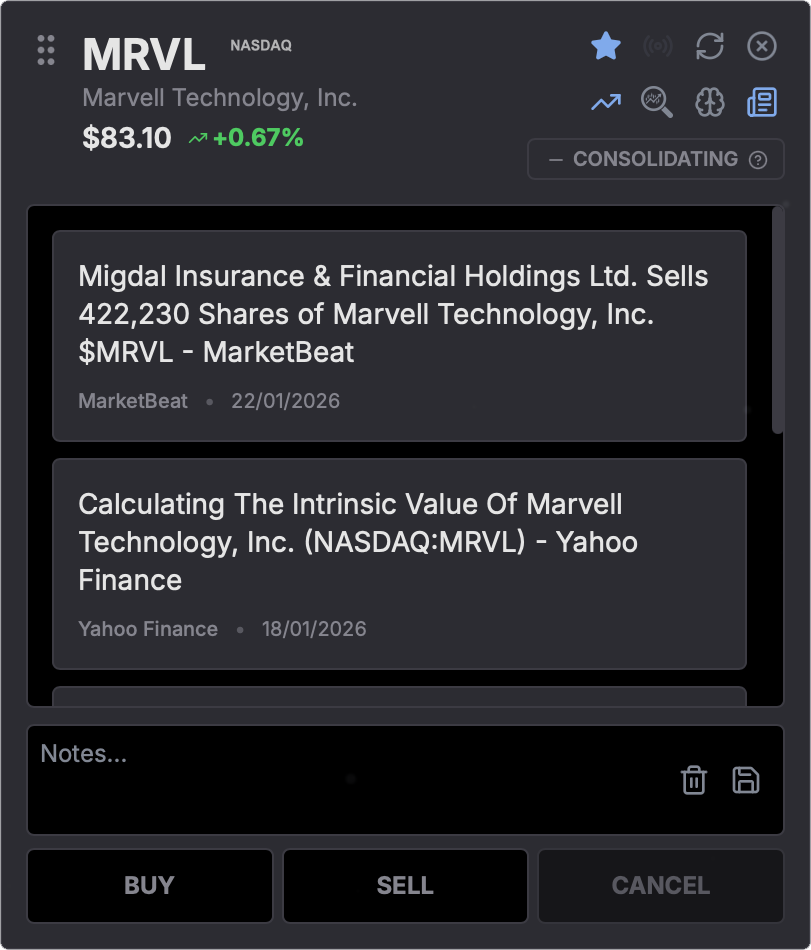
FeaturesPage.toolkit.newsView.title
FeaturesPage.toolkit.newsView.description
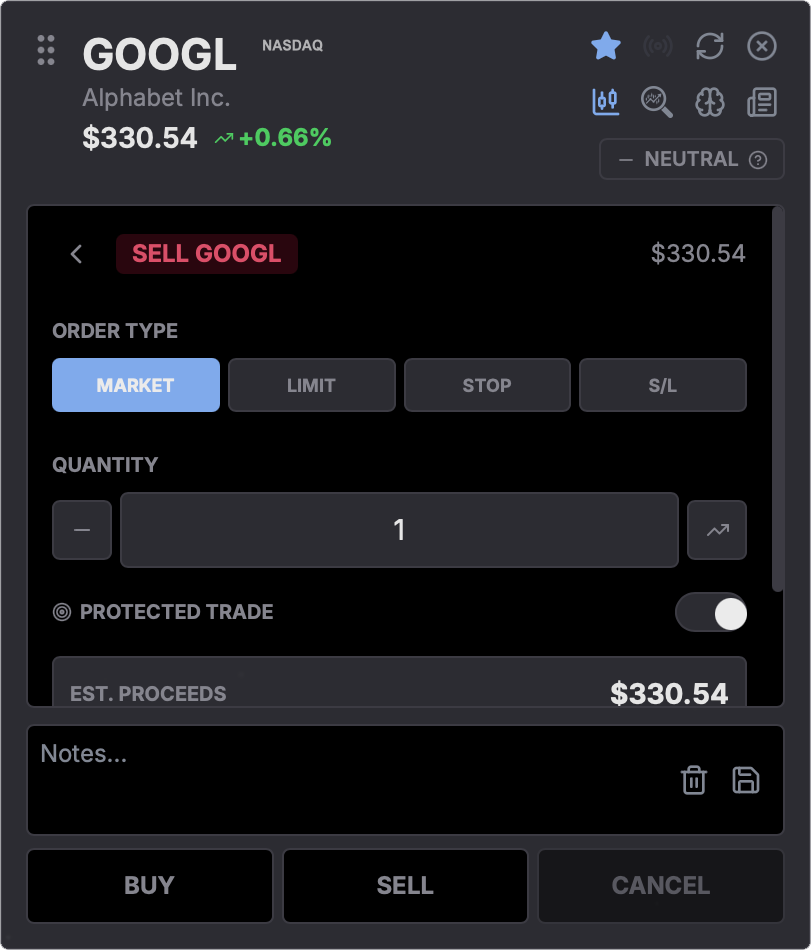
FeaturesPage.toolkit.executionView.title
FeaturesPage.toolkit.executionView.description
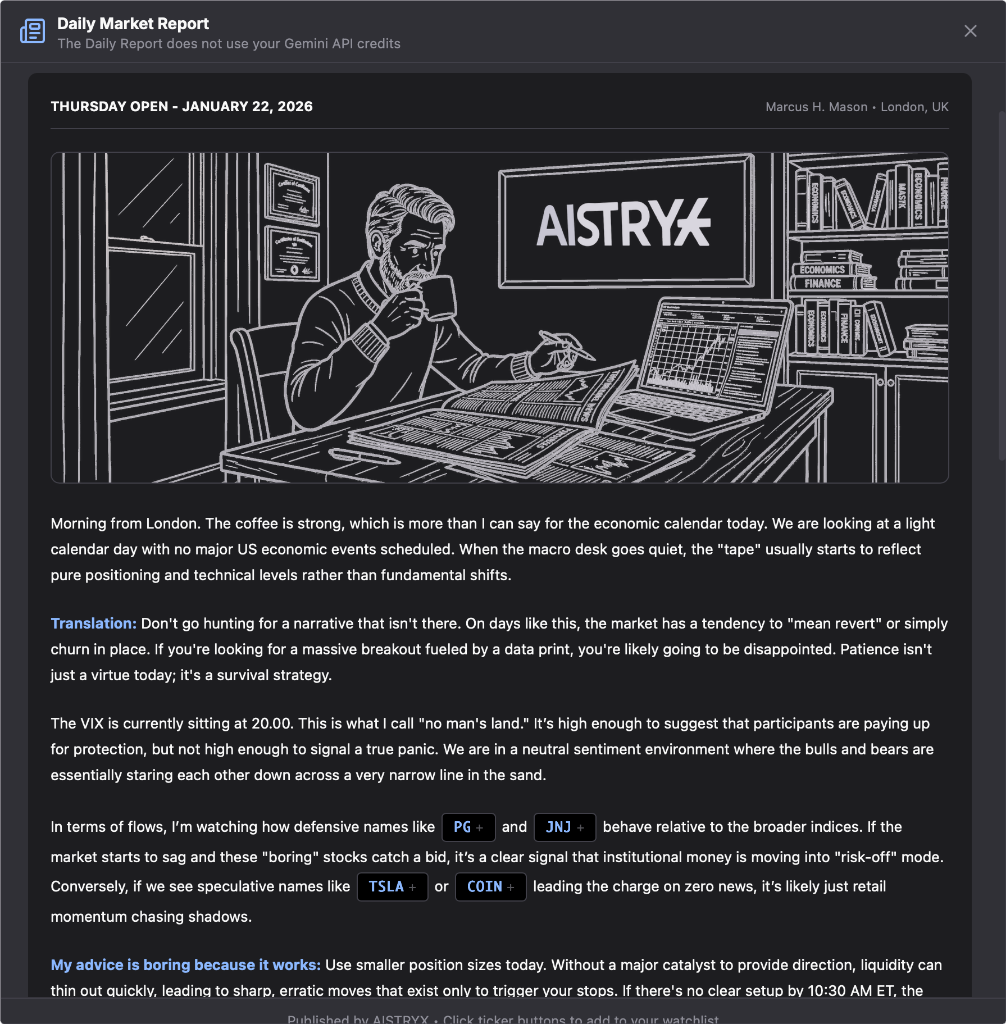
Daily Market Report
FeaturesPage.research.dailyReport.paragraph1
FeaturesPage.research.dailyReport.paragraph2
FeaturesPage.scanner.title FeaturesPage.scanner.titleHighlight
Scan the stocks you care about and see the important information pulled together in one place. Each stock is shown as a clear, focused card that helps you understand the setup before making a decision.
Price and Momentum
RSI, MACD, and short term movement to show pressure and pace.
Trend Context
Moving averages and ADX to indicate whether price is trending or ranging.
Volatility
Bollinger Bands and range behaviour to highlight compression, expansion, and key levels.
Volume and Participation
VWAP and volume ratios to show conviction behind price moves.
Positioning Context
Short interest and institutional exposure for broader positioning insight.
Options Activity
Put call ratios and implied volatility to reflect market expectations.